

Public DSA Disclosures
as Audit Inputs
A Public Reporting Alignment Layer for DSA Audit Readiness and Scoping
Executive summary
The Digital Services Act has made parts of the platform risk and enforcement environment publicly visible. Risk assessment reports, transparency reports, Statements of Reasons, audit reports and audit implementation reports now expose different slices of how VLOPs and VLOSEs identify, report and respond to systemic risk.
Those disclosures were not designed as one connected audit file. A risk described in a public assessment may use one label in the transparency report, appear under several Statement of Reasons categories, sit inside a broad enforcement bucket, or rely on internal evidence that is not publicly available.
This paper proposes a Public Reporting Alignment Layer for DSA systemic-risk audit support. Its purpose is to connect public disclosure layers into a structured review map: risk visibility, category compression, reporting-unit differences, transparency-to-SoR reconciliation needs and internal evidence dependencies.
The layer does not make compliance findings and does not replace statutory audit work. It converts public disclosures into audit-support questions so that VLOPs and VLOSEs can prepare, auditors can scope and regulators can ask more targeted questions without overclaiming what public data can prove.
Public disclosure signal → audit-support question → internal evidence request → auditor validation → systemic-risk conclusion

Concept view: individual public disclosure pieces are important, but together they reveal the systemic-risk picture.
1. The problem: disclosures are public, but not yet audit-ready
Public DSA materials are usually read in parallel: risk assessments explain identified risks, transparency reports give aggregates, Statements of Reasons provide decision-level notifications, and audit reports set out assurance work based on internal access. The systemic-risk questions that matter often sit between these layers.
The challenge is not simply volume. It is the absence of a shared structure across narratives, taxonomies, dates, counting rules, decision states and evidence sources. A notice, an action, an appeal, an account restriction and a decision notification may describe related activity, but they are not interchangeable audit units.
Audit readiness therefore requires public-reporting explainability: the ability to show how risk narratives, aggregate reporting and decision-level outputs relate to each other, and where the answer depends on internal validation.
2. Why public disclosures matter for audit scoping
For VLOPs and VLOSEs, the public disclosure package is now part of the audit environment. It shows how risk and enforcement activity can be read externally before management explanations or internal evidence are provided.
For auditors, public disclosures offer a population-level starting point. They can indicate where enforcement concentrates, which categories are broad, whether decision templates dominate and where automation may deserve targeted review.
For regulators, the same material can support more precise supervisory questions. Public data should not be treated as proof, but it can help identify the internal explanations that should exist.
3. The Public Reporting Alignment Layer
The Public Reporting Alignment Layer is the operational layer between public disclosure and audit judgment. It takes risk assessments, transparency reports, Statements of Reasons, audit reports and audit implementation reports and turns them into a structured map of observable signals, category relationships and evidence gaps.
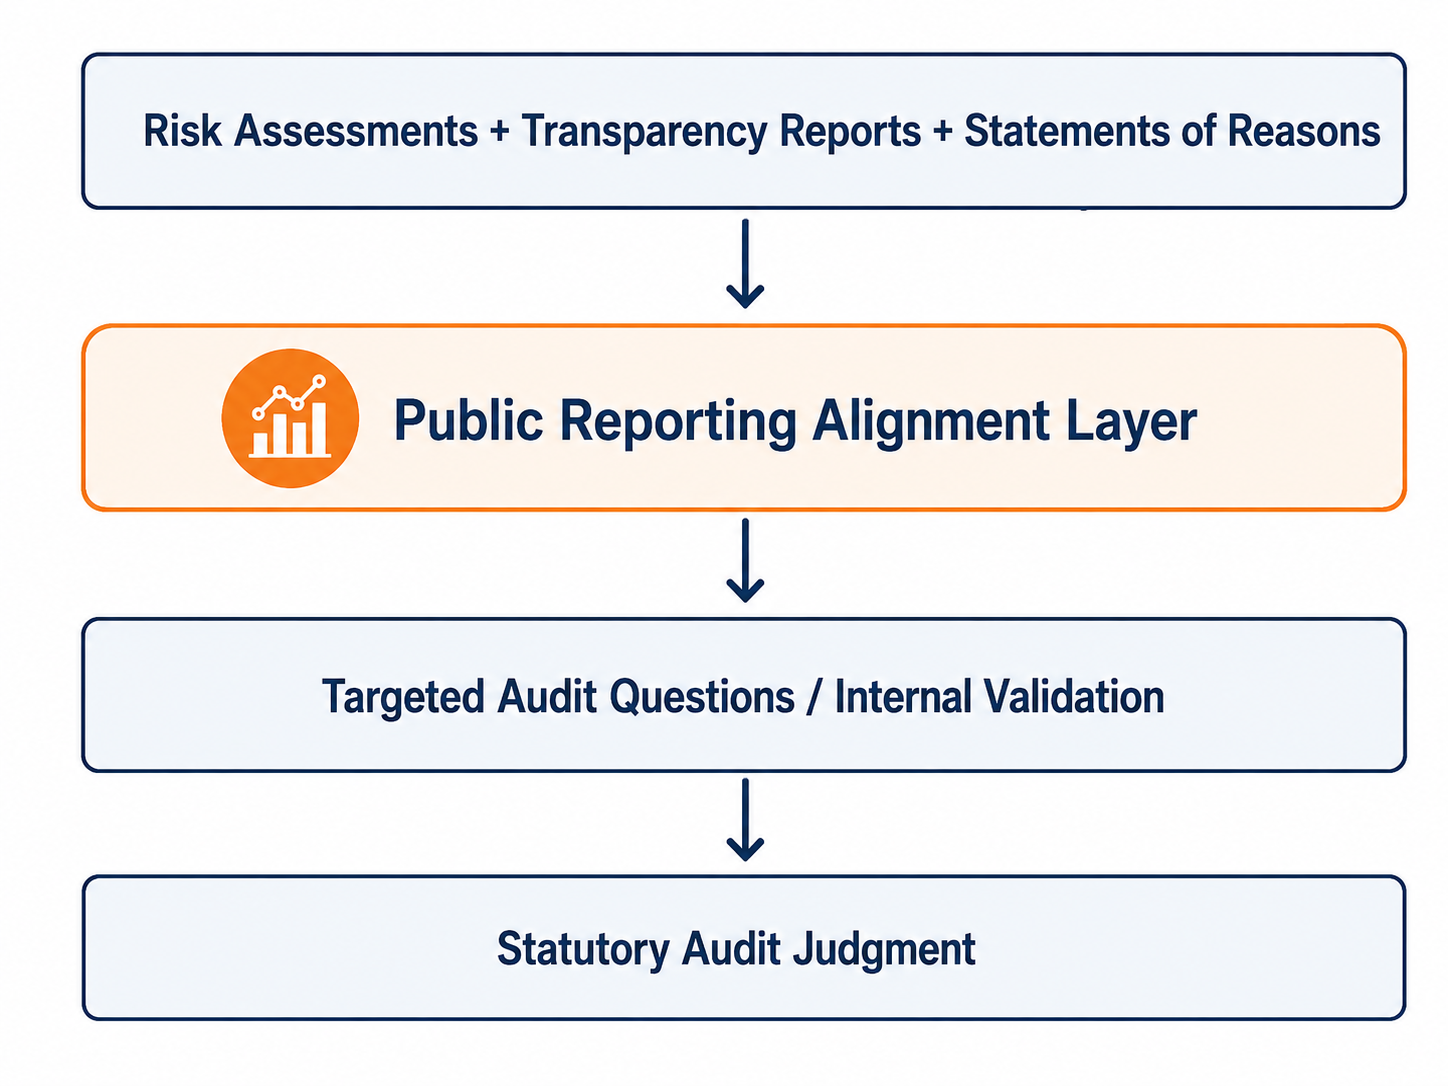
Public Reporting Alignment Layer: connecting public disclosures to audit-support questions and internal evidence needs.
The layer asks a limited but useful question: can the risks described by the provider be observed, mapped and compared across public moderation outputs? If the answer is partial, the layer identifies the gap. If public layers diverge, it defines the reconciliation question.
| Function | What the layer does |
|---|---|
| Risk-to-output mapping | Connects public risk narratives to observable enforcement outputs. |
| Category structure review | Identifies compression, fragmentation and broad buckets that limit traceability. |
| Unit-of-account comparison | Distinguishes notices, measures, accounts, content objects and decision notifications. |
| Audit-question generation | Converts public signals into internal evidence requests rather than conclusions. |
3. The Public Reporting Alignment Layer
The Public Reporting Alignment Layer is the operational layer between public disclosure and audit judgment. It takes risk assessments, transparency reports, Statements of Reasons, audit reports and audit implementation reports and turns them into a structured map of observable signals, category relationships and evidence gaps.
The layer asks a limited but useful question: can the risks described by the provider be observed, mapped and compared across public moderation outputs? If the answer is partial, the layer identifies the gap. If public layers diverge, it defines the reconciliation question.
| Function | What the layer does |
|---|---|
| Risk-to-output mapping | Connects public risk narratives to observable enforcement outputs. |
| Category structure review | Identifies compression, fragmentation and broad buckets that limit traceability. |
| Unit-of-account comparison | Distinguishes notices, measures, accounts, content objects and decision notifications. |
| Audit-question generation | Converts public signals into internal evidence requests rather than conclusions. |
4. Boundary conditions
The value of the layer depends on disciplined limits. It is not a compliance score, a finding engine, a replacement for statutory audit work or a claim that public reporting layers should numerically match.
It does not infer prevalence, exposure, recommender impact, model performance or mitigation effectiveness from public data alone.
The governing principle is the non-inference rule: public-layer variance is treated as a signal that counting units, taxonomies, source systems, reporting periods or decision states may need explanation. The conclusion belongs only after internal validation.
5. From disclosure to audit signal
An audit signal is a reason to ask a better question. The alignment layer classifies public patterns so the next step is clear.
| Signal status | Meaning |
|---|---|
| Observable | The risk area is visible in public decision or aggregate data. |
| Compressed | The risk appears inside a broad or generic public category. |
| Fragmented | The risk is split across several categories, templates or fields. |
| Unobservable | Public data does not show the risk clearly. |
| Internal-dependent | Public data shows an output pattern, but the relevant conclusion requires internal evidence. |
| Reconciliation variance | Public reporting layers differ in count, category, source, action or automation logic. |
| Public signal | Audit-support question | Internal evidence needed |
|---|---|---|
| High enforcement volume | What explains the volume: exposure, detection, classification scope or workflow design? | Prevalence, exposure, detection trends, internal taxonomy and quality metrics. |
| Broad category bucket | Which systemic risks sit inside the public category? | Internal category decomposition and mapping from public to internal taxonomy. |
| Transparency-SoR variance | Do the datasets use the same unit, period, source channel and decision state? | Source-system lineage, extraction logic, de-duplication rules, date definitions and appeal treatment. |
| High automation involvement signal | Where do public SoR fields indicate automated detection or decision-making, and how does this vary by category, language, source, restriction type or template? | Internal model QA, precision/recall, false positives, false negatives, reviewer overrides, QA outcomes, model versioning and decision-path documentation. |
6. The central reconciliation problem: transparency reports and Statements of Reasons
Transparency reports and SoR datasets often describe related enforcement activity using different objects. A transparency report may count Article 16 notices, own-initiative measures, appeals, automated measures, category totals or moderation resources. A SoR population counts decision notifications with grounds, restrictions, sources, automation fields and timing information.
The right objective is not to force a false tie-out. The objective is to make the relationship explainable where comparison is meaningful.
| Reconciliation area | What it compares | Audit-support question |
|---|---|---|
| Count variance | Aggregate totals against SoR population totals | Are the compared figures measuring the same unit, period and source channel? |
| Category variance | Transparency categories against mapped SoR categories | Do public categories preserve the relevant risk distinctions? |
| Notice-to-SoR funnel | Article 16 notices against Article 16-sourced SoRs | At aggregate level, how are Article 16 notices reflected in Article 16-sourced SoRs, and what internal evidence would explain the notice-to-decision pathway? |
| Measure-to-SoR funnel | Reported measures against SoR restrictions and account actions | Are moderation measures and decision notifications traceable across systems? |
| Automation variance | Transparency automation totals against SoR automation fields | Are definitions of automation consistent across public outputs? |
7. What this looks like in practice
A practical audit-support module should move from population overview to record-level explainability. The sequence is designed to help a user find the areas that need attention and then drill into the public records behind them.
Scope overview → category focus → template concentration → record review → record-level explainability → internal evidence request
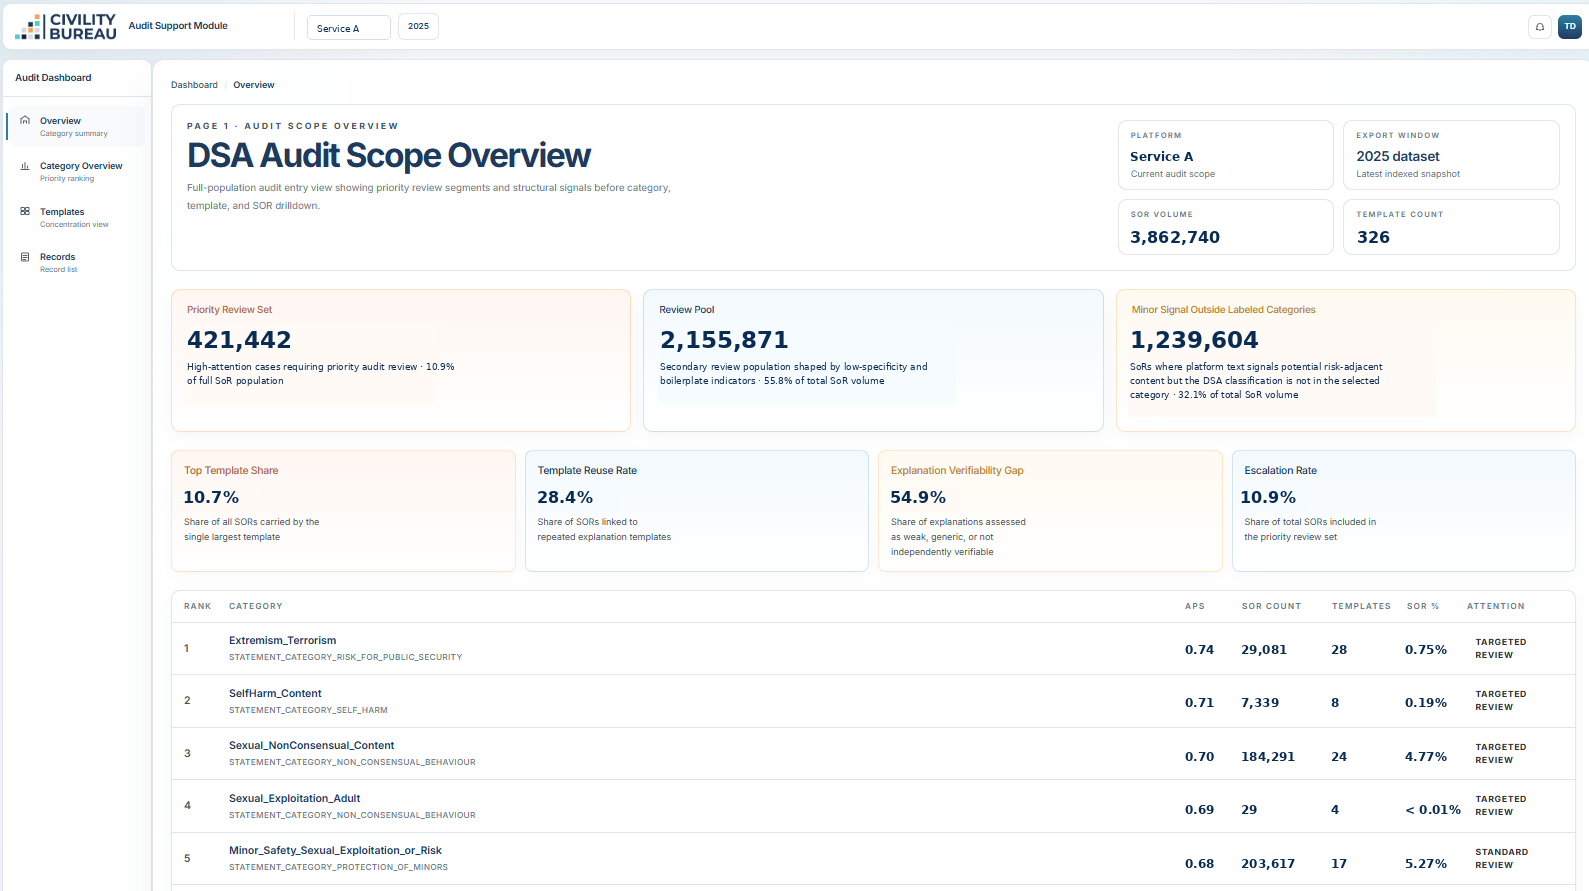
Figure 1. Scope overview: population size, priority review set, review pool, template reuse and ranked categories.
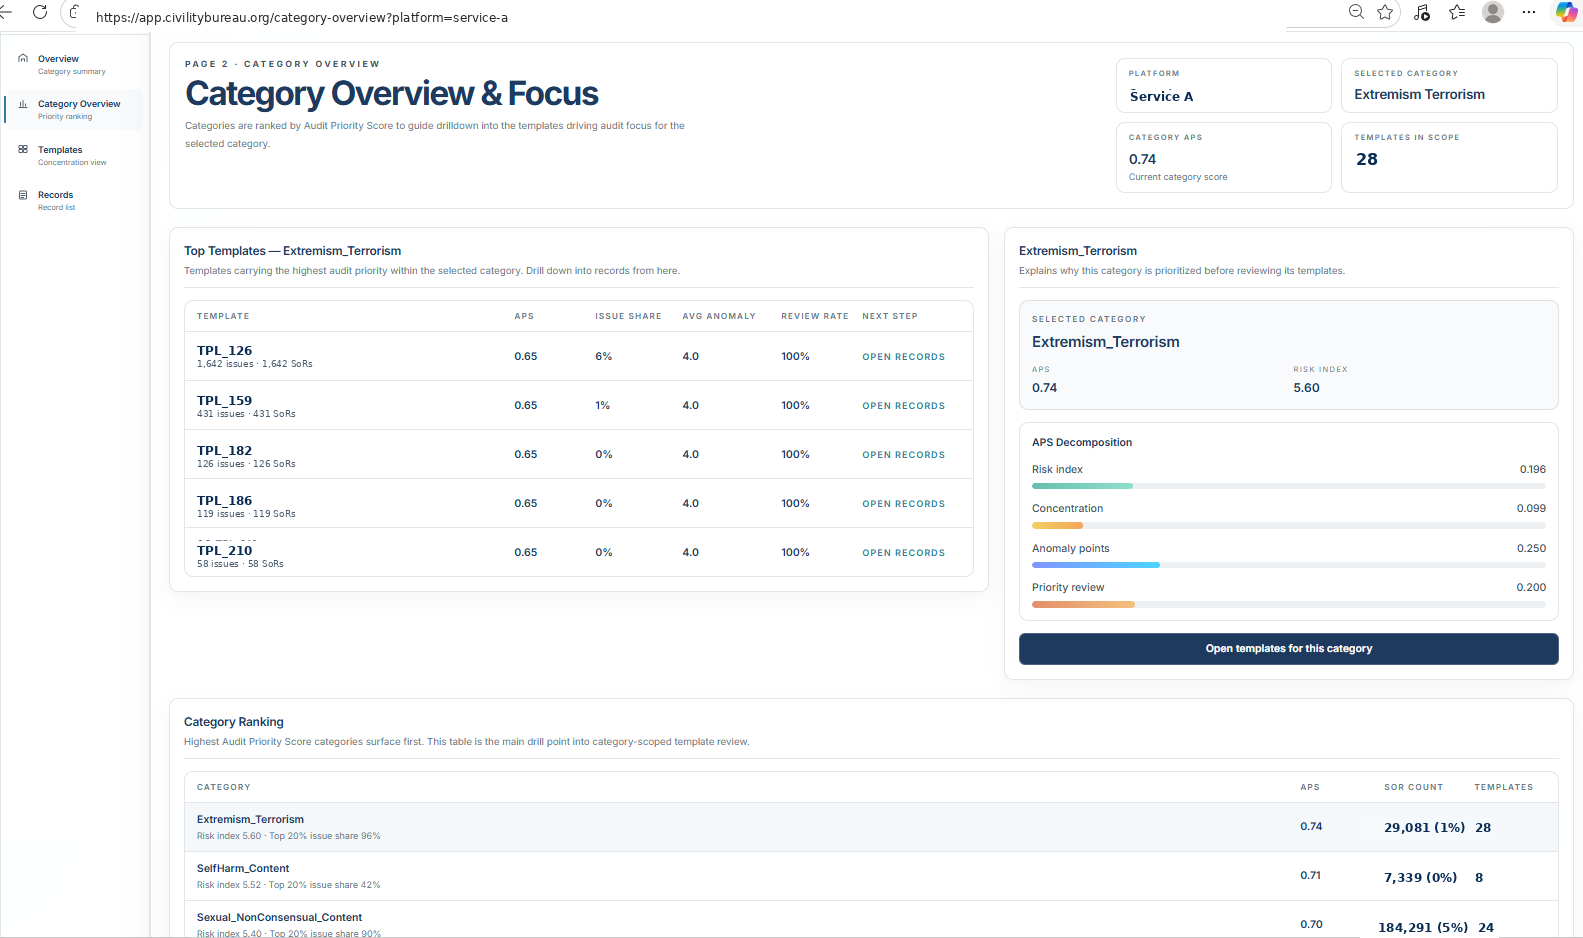
Figure 2. Category focus: selected category score, top templates and decomposition of priority drivers.
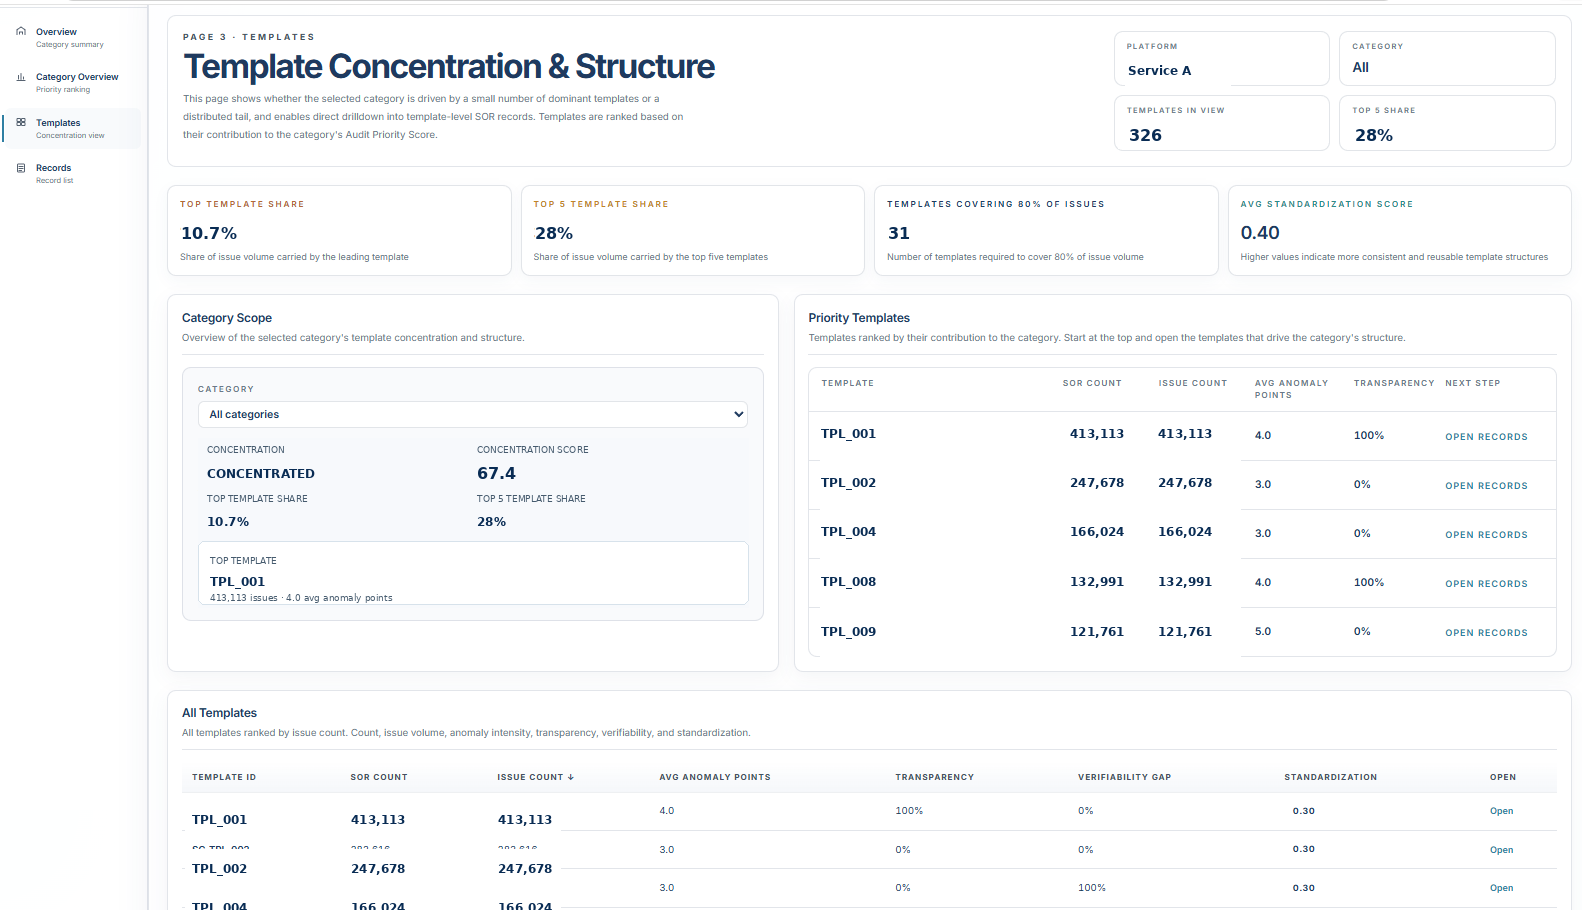
Figure 3. Template concentration: concentration score, top-template share and templates ranked by issue contribution.
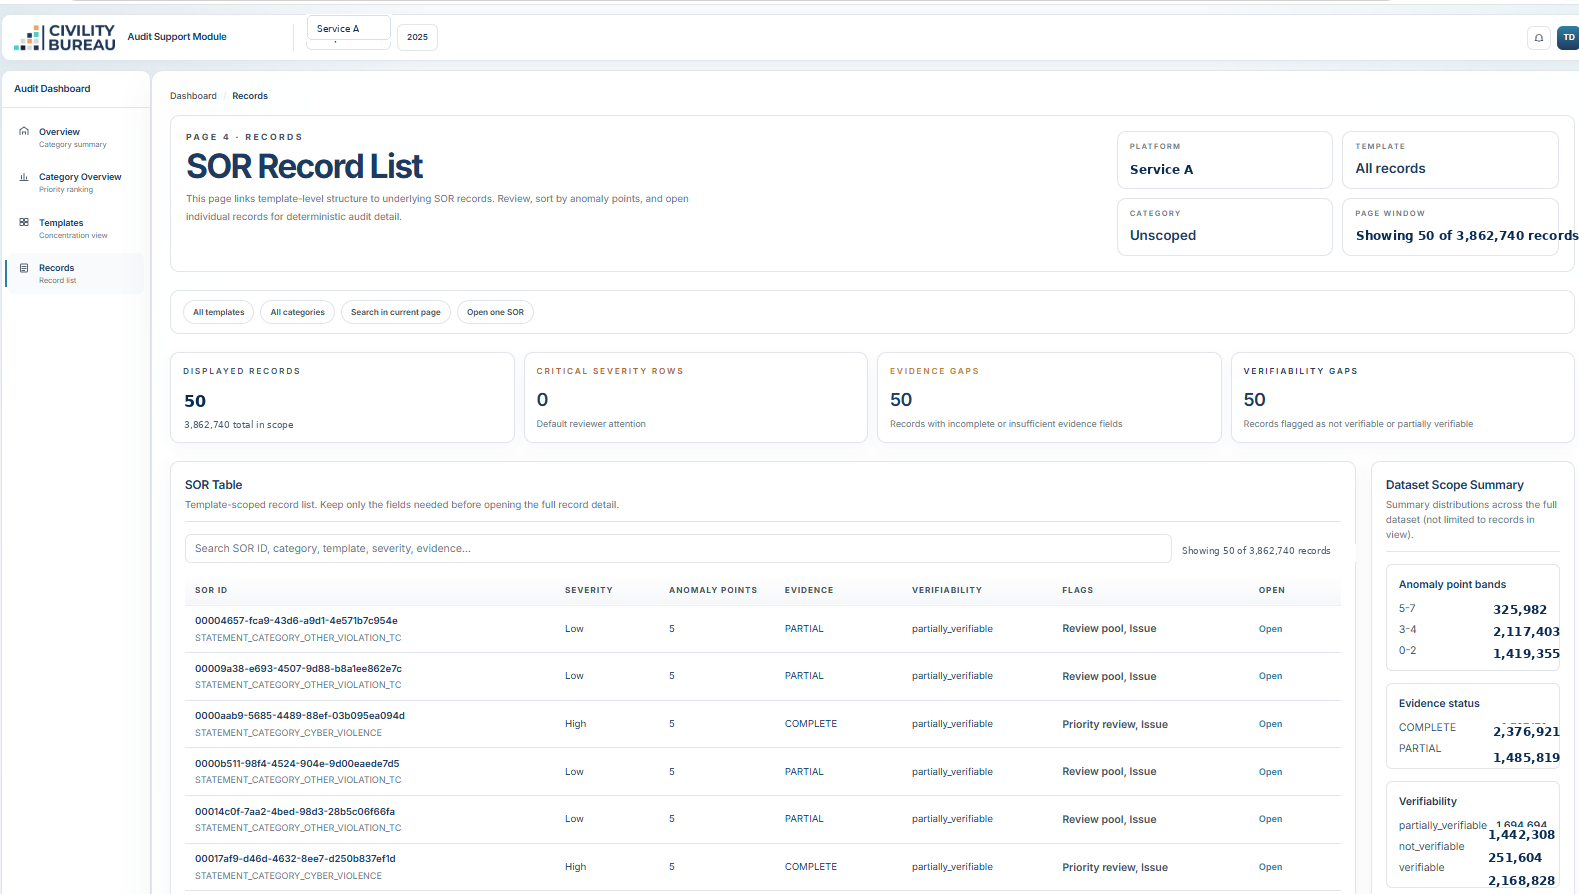
Figure 4. SoR record list: filterable decision population with evidence, verifiability and anomaly fields.
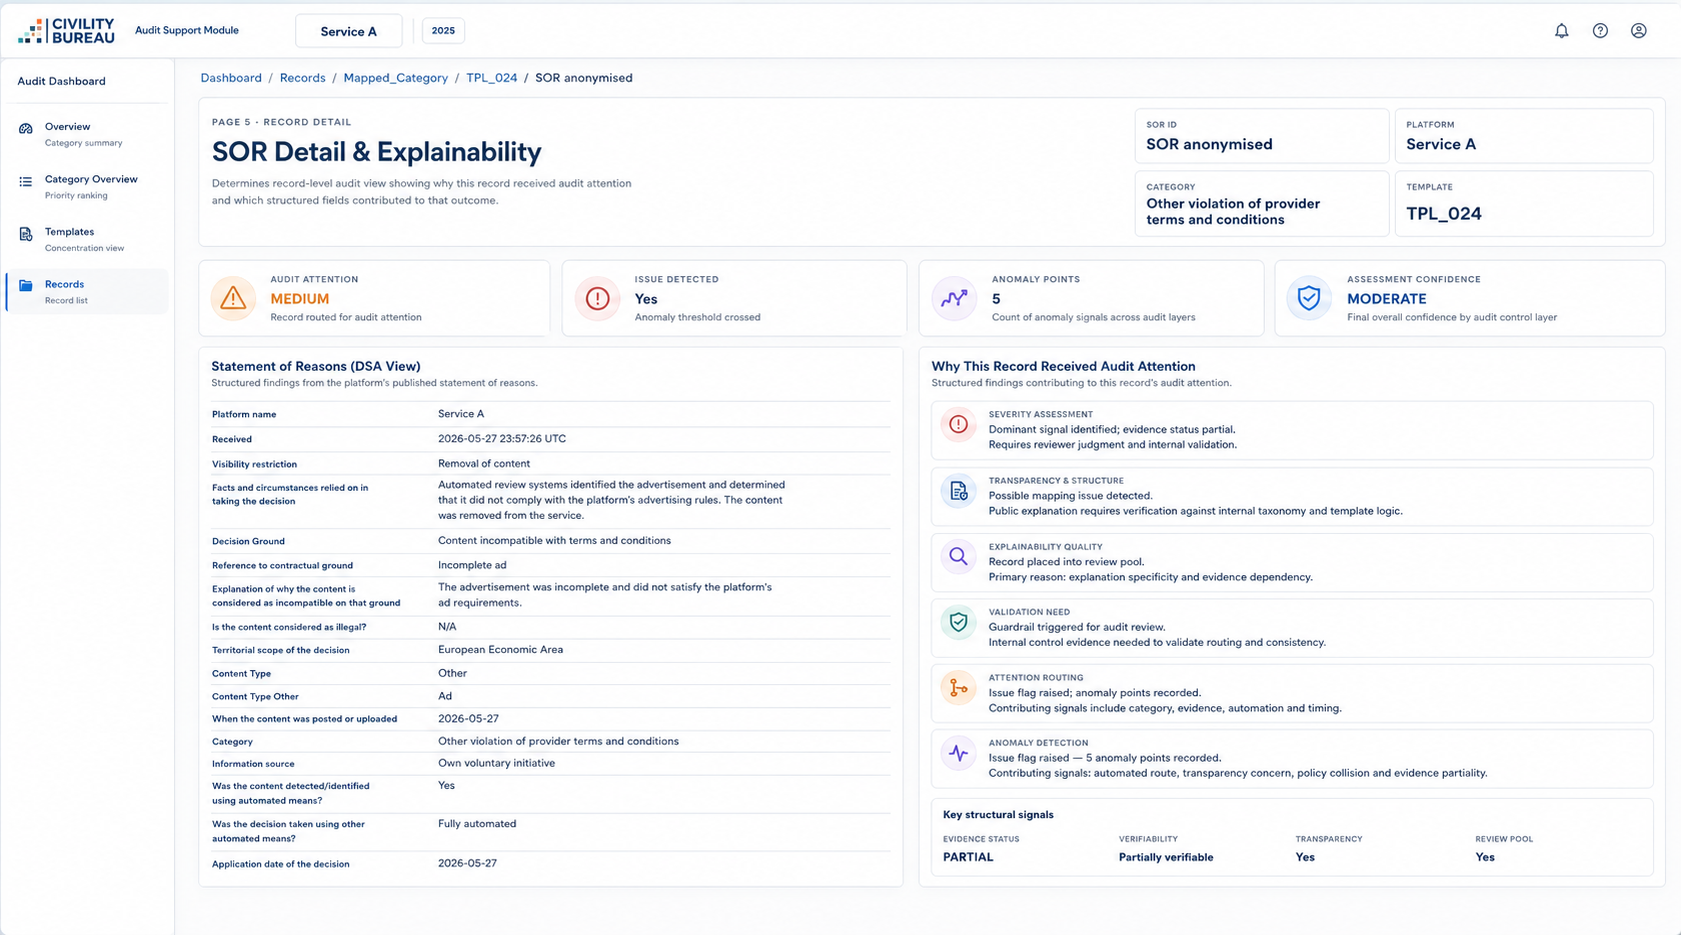
Figure 5. SoR detail and explainability: individual record view linking public fields to audit-attention reasons.
8. Public observability and internal dependency
The alignment layer is strongest where public data shows output patterns. It is limited where the relevant evidence is internal by nature. A useful review therefore separates public observability from internal dependency at the start.
| Audit area | Publicly observable | Requires internal data | Reason |
|---|---|---|---|
| Policy existence | Yes | Sometimes | Public terms are visible; internal guidance may differ. |
| Enforcement scale | Yes | Sometimes | SoRs and transparency reports show output patterns. |
| Risk-category presence | Yes | Sometimes | Public data can show whether a risk area appears in decisions. |
| Category precision | Partial | Yes | Broad categories need internal decomposition. |
| Exposure / prevalence | No | Yes | Enforcement volume is not exposure. |
| Recommender impact | No | Yes | Public descriptions do not reveal ranking, reach or distribution logs. |
| Mitigation effectiveness | Partial | Yes | Causality requires internal measurement and control evidence. |
| Automation involvement and limits | Yes, where SoR fields are populated | Yes | SoRs can show whether automated means were used and can be analysed by public fields such as category, language, source, restriction type and template. They do not show precision, recall, false positives, false negatives, reviewer overrides, QA outcomes, model versioning or model-level performance. |
9. Examples of audit-support signals
9.1 Fraud, scams and spam
Fraud, scams and spam may appear across risk narratives, transparency aggregates and several SoR categories. Fragmentation is expected because these behaviours often cross policy boundaries. The audit question is how the platform maps public labels to internal risk taxonomies and whether trend claims are supported by exposure, prevalence, detection-quality evidence and, where available, internal appeal or aggregate complaint/reversal data.
9.2 Sexual-content enforcement
Sexual-content categories can combine distinct risk concepts, including adult sexual content, child sexual exploitation, grooming, sextortion, pornography, sexual harassment and non-sexual nudity exceptions. If the public category is broad, internal decomposition is needed before category-specific risk conclusions can be tested.
9.3 Minor-related risk
Minor-related signals are audit-relevant even where volumes are lower. Public enforcement records may show activity, but actual exposure, age segmentation, recommender distribution, escalation paths, false negatives and reviewer quality require internal evidence.
9.4 Broad public categories
Large volumes in categories such as “other violation” or “platform policy violation” may be operationally valid, but they are weak for systemic-risk traceability. The necessary follow-up is a public-to-internal category map and an explanation for the level of aggregation used in public reporting.
9.5 Automation
Public SoR fields may show whether automated means were used in detection or decision-making. Where those fields are populated, automation involvement can be analysed by public fields such as category, language, source, restriction type and template.
That does not show automation performance. Public data does not provide precision, recall, false positives, false negatives, reviewer overrides, QA outcomes, model versioning or model-level validation. Those questions require internal evidence.
10. Article-level relevance
The Public Reporting Alignment Layer is most useful where DSA obligations produce public or redacted public materials that can be compared across layers: Statement of Reasons decision notifications, transparency reporting, systemic-risk assessment, mitigation measures, independent audit and audit implementation reporting.
It is less useful where the evidence is inherently internal, such as governance effectiveness, recommender logs, exposure measurement, false-negative analysis and causal assessment of mitigation measures. That limitation defines the handover from public signal review to statutory audit work.
11. Value for VLOPs and VLOSEs
For VLOPs and VLOSEs, the layer supports audit readiness. It shows how public risk categories, transparency categories and SoR outcomes appear when viewed together. This helps management identify where public disclosures are clear, where categories need explanation and where internal evidence will likely be requested.
| Readiness output | Practical use |
|---|---|
| Risk-to-output map | Connect risk narratives to public enforcement signals. |
| Transparency-to-SoR reconciliation pack | Prepare counting-unit, period and source-system explanations. |
| Category decomposition | Show which internal risks sit inside broad public categories. |
| Evidence request plan | Assemble documents and owners before audit fieldwork. |
| Automation support | Prepare internal QA, model-performance and review-outcome evidence for categories where public SoRs show automation involvement. |
12. Value for auditors
For auditors, the layer is a scoping and targeting aid. It provides a population view before sample selection and internal control testing. This can improve risk-based sampling, evidence-request design, completeness thinking and documentation of where public data ends and internal evidence begins.
The layer does not tell the auditor what conclusion to reach. It helps determine which categories, templates, explanations, automation signals and reconciliation variances deserve audit attention.
13. Value for regulators and supervisory teams
For supervisory teams, the layer provides a disciplined way to read public disclosures. It avoids treating enforcement volume as proof of risk while still allowing public risk narratives, aggregate figures and decision-level outputs to be compared.
The resulting questions are more precise: which risk is visible, which category hides it, which public figures are comparable, what internal evidence should exist, and what management reconciliation should explain the observed relationship?
14. Recommended workflow
- Map public risk assessment, transparency-report and SoR categories.
- Identify counting units: notices, measures, accounts, content objects and decision notifications.
- Compare transparency aggregates to SoR populations where the units are meaningfully related.
- Classify risk areas as observable, compressed, fragmented, unobservable, internal-dependent or reconciliation-dependent.
- Flag high-volume categories, template concentration and automation signals.
- Translate the public signal into internal evidence requests for auditor validation.
15. Closing position
The DSA disclosure stack is more useful when it is read as a system rather than as separate documents. A Public Reporting Alignment Layer creates that system view by connecting risk narratives, aggregate figures, decision records and internal evidence requests.
Where the public layers align, audit work starts with a stronger population view. Where they do not, the layer identifies what must be reconciled before any conclusion is drawn. Public DSA disclosures are now audit inputs; the task is to make them structured and useful without pretending they can prove more than they can.